Capital Insights: The Average Midterm Year Doesn't Exist
Sep 22 2026 | Back to Blog List
VIDEO TRANSCRIPT:
Hi, I'm Trent Von Ahsen, partner with Cedar Point Capital Partners. Welcome to the September 2026 edition of Capital Insights.
Well, if you've driven anywhere lately, you've noticed the yard signs multiplying. The midterms are about seven weeks out, and we've started hearing a familiar question: "Should I be doing something with my portfolio before the election?"
History is part of why people ask. Midterm years have a reputation on Wall Street. Going back decades, they've tended to be more volatile than other years, and they've tended to deliver weaker returns.
So, let's see how 2026 has measured up against that reputation. The short answer is not very well. And that's the interesting part.
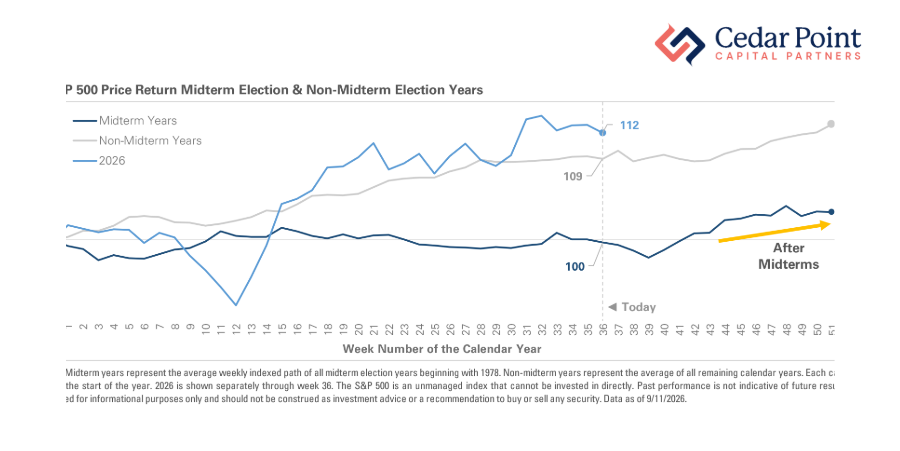
Figure 1 compares three paths for the S&P 500, each indexed to 100 at the start of the year, so we're looking at percentage moves week by week rather than price levels.
The dark blue line is the average midterm year, going back to 1978. The gray line is the average of every other year. And the lighter blue line is this year, through September 11th.
Start with the two averages. Notice how the midterm line just sits there. Thirty-six weeks in, it's right back at 100, flat for the year. The gray line, at the same point, is up about 9%. That gap is the midterm reputation in one picture.
Now look at 2026. Early on, it lived up to the billing. The line drops hard into mid-March, the sell-off around the conflict in the Middle East and the spike in oil prices, and for a few weeks this year was the lowest line on the chart.
Then it turned. From that low, the index rebounded more than 20%, and it's now up nearly 12% for the year. That's well ahead of the average midterm year, and ahead of the average non-midterm year, too.
So the volatility midterm years are known for showed up right on schedule. But the cause wasn't the election. It was oil, long-term interest rates, and a Federal Reserve outlook that kept shifting. And the weak returns that usually come with it never followed.
Here's what I'd pull out of this. The midterm pattern exists for a real reason. Those years carry extra policy uncertainty, around taxes, spending, and regulation, and markets don't like unresolved questions. That just isn't what moved markets this year. What did was corporate earnings that kept beating expectations, an economy that kept expanding, and heavy investment in artificial intelligence flowing into data centers, chips, and power infrastructure. None of those run on the election calendar.
One more thing about that flat midterm line. It's an average of twelve very different years. It blends 2002 and 2022, when the index finished sharply lower, with years like 2010 and 2014, when it finished up double digits. Average them together and you get a line that goes nowhere, a path no single year actually followed.
That's the trap with historical averages. They describe what markets have tended to do. They become a problem the moment we treat one as a forecast for a particular year. An investor who entered 2026 braced for a flat, choppy midterm year would have been right about the choppy part, and wrong about everything else.
Both averages also drift higher after the election, and I'd read that the same way. It's what has tended to happen once attention returns to earnings and growth. It's context for the road ahead, not a promise about the destination.
So, back to the question. Should you do something before the election? Elections run on their own calendar. Your plan runs on a different one, built around your goals, your timeline, and how much risk you're comfortable carrying along the way. Whether that plan still fits you is always worth checking. November isn't the reason to check it though.
If you have any questions about this video or your portfolio, reach out and let's start the conversation.
My name is Trent Von Ahsen, and I look forward to seeing you right here next month for our latest edition of Capital Insights.
Stay curious, stay mindful of your goals, and we'll see you next time.
The commentary on this blog reflects the personal opinions, viewpoints, and analyses of Cedar Point Capital Partners (CPCP) employees providing such comments and should not be regarded as a description of advisory services provided by CPCP or performance returns of any CPCP client. The views reflected in the commentary are subject to change at any time without notice. Nothing on this blog constitutes investment advice, performance data or any recommendation that any particular security, portfolio of securities, transaction, or investment strategy is suitable for any specific person. Any mention of a particular security and related performance data is not a recommendation to buy or sell that security. Cedar Point Capital Partners manages its clients’ accounts using a variety of investment techniques and strategies, which are not necessarily discussed in the commentary. Investments in securities involve the risk of loss. Past performance is no guarantee of future results.