Capital Insights: Feelings vs. Facts in Economic Data
May 27 2025 | Back to Blog List
VIDEO TRANSCRIPT:
Hi, I’m Trent Von Ahsen, partner with Cedar Point Capital Partners. Welcome to the May 2025 edition of Capital Insights.
This month, we’re exploring a key distinction in economic reporting—the difference between soft and hard data, and why that gap matters for investors.
Now, let’s start with soft data.
Soft data typically comes from surveys—things like consumer sentiment and business expectations, or more generally stated, how market participants are currently feeling. These numbers can shift quickly with headlines or political developments.
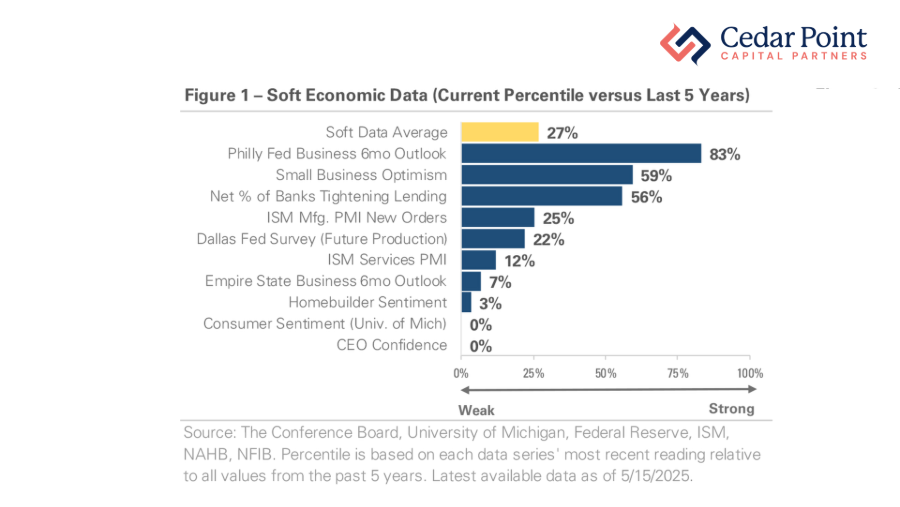
As you can see here in Figure 1, comparing 10 soft data indicators to the past five years, datapoints like CEO confidence and consumer sentiment are sitting near historic lows. We can also see the average of all 10 soft indicators is only at the 27th percentile.
Now, that’s a clear sign people are feeling uncertain. But, what have they actually been doing?
For that, we turn to the hard data, which includes things like payroll growth, retail spending, and durable goods orders—in other words, factual economic results.
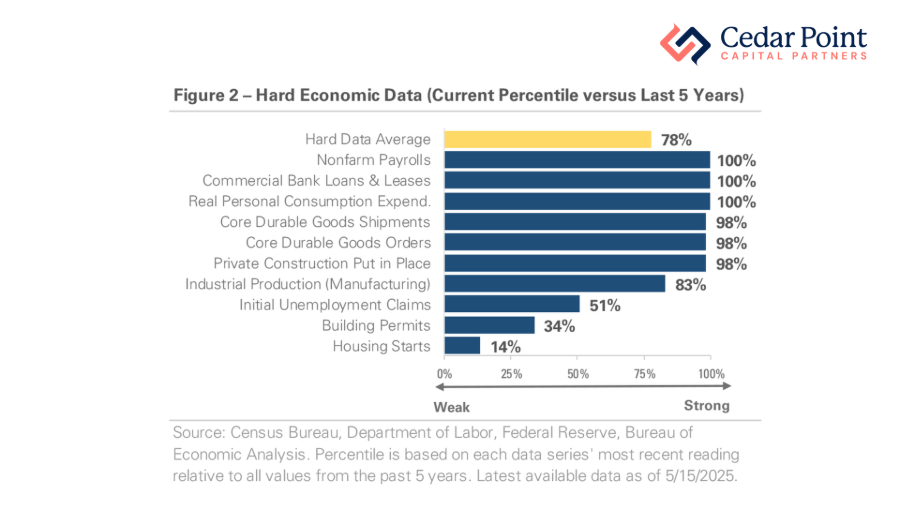
Here in Figure 2, by contrast, the picture is much more optimistic. The average hard indicator is ranked in the 78th percentile, with clear strength in hiring, consumer spending, and bank lending numbers. Slower building permits and housing starts are dragging down the average, but general indicators here are broadly positive.
So, what’s our takeaway from all of this?
Well, the economic data tells a mixed story. Soft indicators reveal a cautious sentiment among consumers and businesses, while the hard data shows that economic activity for those same folks has not yet shown signs of slowing.
Both types of data are valuable, for different reasons. To borrow a weather analogy, soft data is a little bit like next week’s precipitation forecast. It gives you a sense of what to expect as you plan your calendar, but it’s not always accurate. On the other hand, hard data is a lot like looking out the window—like a wet sidewalk, it tells you what has been happening. Given how quickly conditions are changing, we’re tracking both kinds of indicators to keep a clear view of the economy.
We believe it is critical to ground our decisions in evidence, not emotion. That means focusing more on what businesses and consumers do—not just what they say.
If you have any questions about this video or your portfolio, reach out and let’s start a conversation.
My name is Trent Von Ahsen, and I look forward to seeing you right here next month for our latest edition of Capital Insights.
Stay curious, stay mindful of your goals, and we’ll see you next time.
The commentary on this blog reflects the personal opinions, viewpoints, and analyses of Cedar Point Capital Partners (CPCP) employees providing such comments and should not be regarded as a description of advisory services provided by CPCP or performance returns of any CPCP client. The views reflected in the commentary are subject to change at any time without notice. Nothing on this blog constitutes investment advice, performance data or any recommendation that any particular security, portfolio of securities, transaction, or investment strategy is suitable for any specific person. Any mention of a particular security and related performance data is not a recommendation to buy or sell that security. Cedar Point Capital Partners manages its clients’ accounts using a variety of investment techniques and strategies, which are not necessarily discussed in the commentary. Investments in securities involve the risk of loss. Past performance is no guarantee of future results.